In the past few weeks, we had a lot of feedback about how our v3 dashboard displays the “Annual Percentage Yield” (APY) of deposited assets. Especially on Fantom where the ecosystem has more volatile prices and strategies, we deployed short-term changes to how APY is displayed to represent the yield received by weve and 0xdao. When we reverted to our previous calculations we didn’t consider long-term APY calculations being inflated, now we have pushed an update to correct that mistake. This article aims to give more context on what happened and our solution!
Quick Context: APR and APY?
In DeFI we often see these 2 terms a lot:
APR: Annual Percentage Rate
APY: Annual Percentage Yield
Both are used to communicate to the user how much they expected to gain over an investment:
APR assumes no automatic compounding of yield
APY indicates that yield is auto-compounded into the investment
What we learned
We updated the way our interface shows APYs a few weeks ago when going through ve(3,3) wars on Fantom in order to better reflect the APY using recent harvests data. Before this change, we showed more conservative APYs based on long-term historical data, but during the wars most Fantom vault APYs skyrocketed and short-term gains weren’t being shown properly to the users. We made a change to show a number based on recent harvest so people could see our vaults were farming the most profitable protocols:
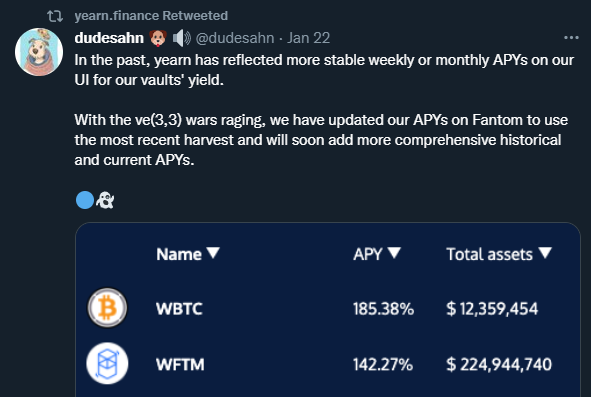
The downside of calculating APY via recent data is: when the gains from the wars started diminishing, we showed a number that came from really profitable recent harvests but next harvests were probably not gonna be as profitable (diminished emissions from community protocols built to farm the war, less hardcore speculation after the top 20 TVL snapshot was taken) so we decided to make some changes to fix this case.
So we had a really conservative APY calculation before the mentioned episode above, then we changed to focus on recent data. Going through these 2 extremes made us learn a lot about what works and what doesn’t! Here is how we do it now:
For vaults that use non-curve assets:
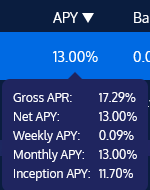
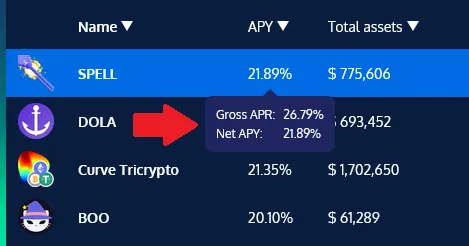
Gross APR: Vault total APR before deducted fees
Net APY: Vault current APY
Weekly APY: Based on the last 7 days harvests
Monthly APY: Based on the last 30 days harvests
Inception APY: Based on all harvests since the vault exists
For vaults that use curve assets:
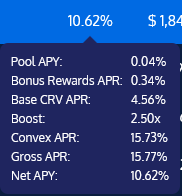
Pool APY: APY from the fee of curve swaps on that pool, half goes here half to veCRV holders.
Bonus Rewards APR: Rewards added generally by the owner of that token. IE frax curve pools also gives you frax. The APY if you sold the token at current price.
Base CRV APR: The APR of the minimum amount of crv emissions this curve pool gets. (if you do not have staked veCRV for boost you get this + pool apy + the bonus rewards.
Boost: Boost how much of the multiplier you get from staked veCRV
Convex APR: Current convex apr if you deposit to convex
Gross APR: Vault total APR before deducted fees
Net APY: Vault current APY
Thanks to everyone that gave feedback on this feature and also to the teams that quickly acted on it. We hope the new display better reflects the reality of a vault’s gains!
Producer: Worms, Reviewers: x48, *Vany, *Dark Ghosty